


Re/max Premier Inc., Brokerage
9100 Jane St
Concord, ON
L4K 0A4


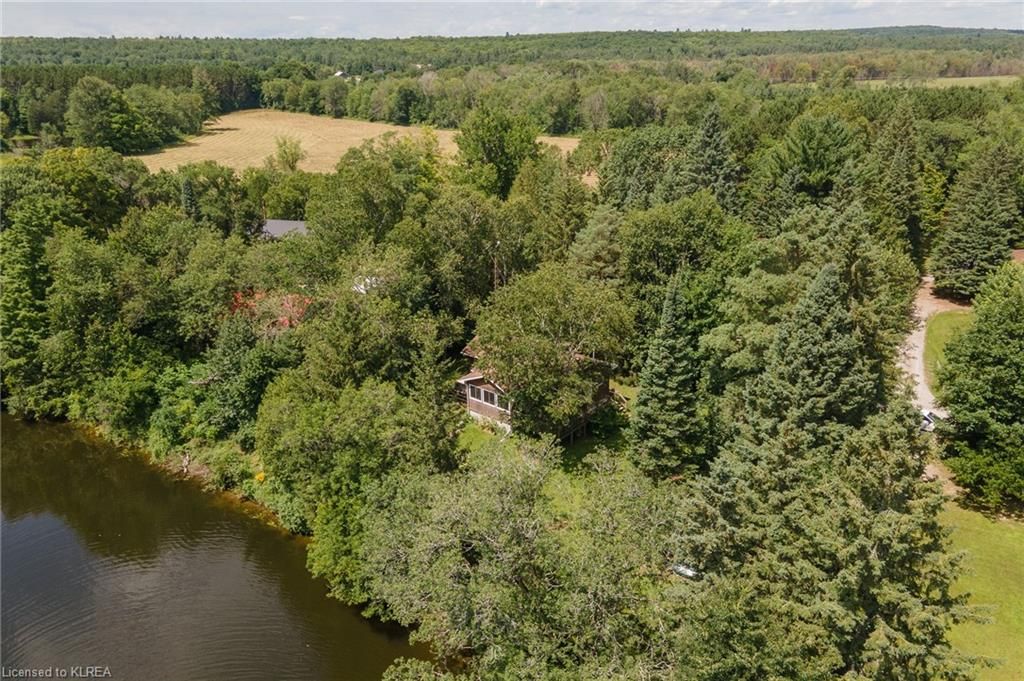


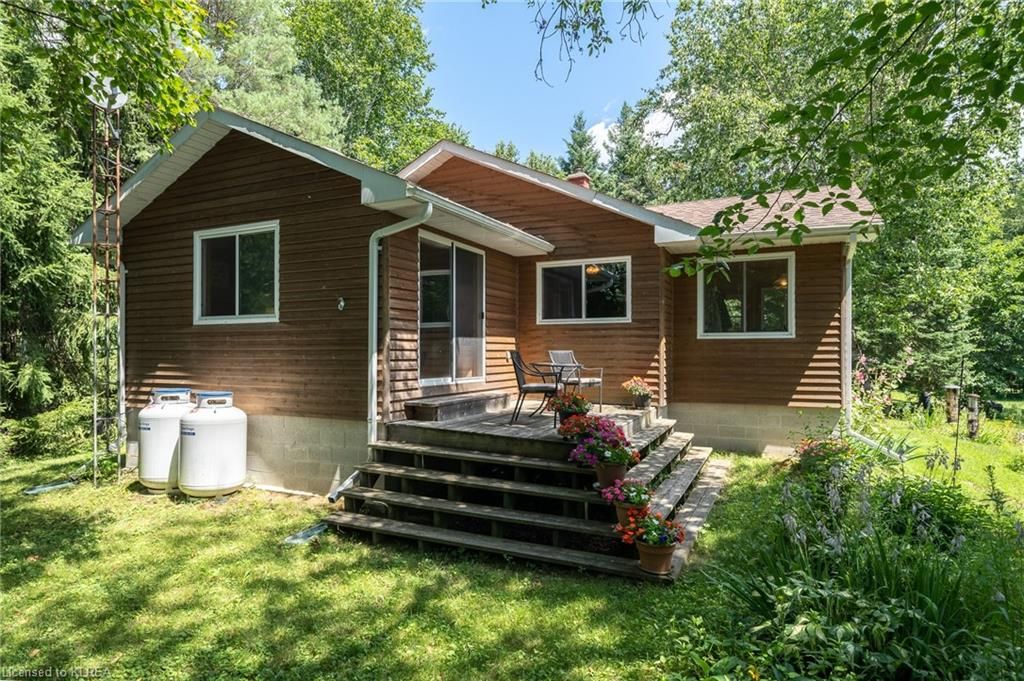
Burnt River, somerville township, K0M 1C0
$649,900$000000
Listed by RE/MAX ALL-STARS REALTY INC., BROKERAGE - 132.
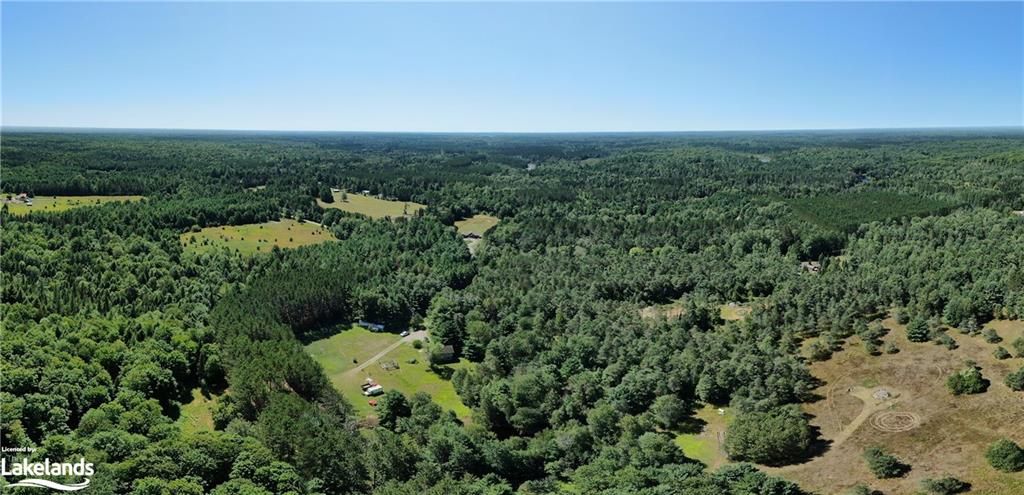
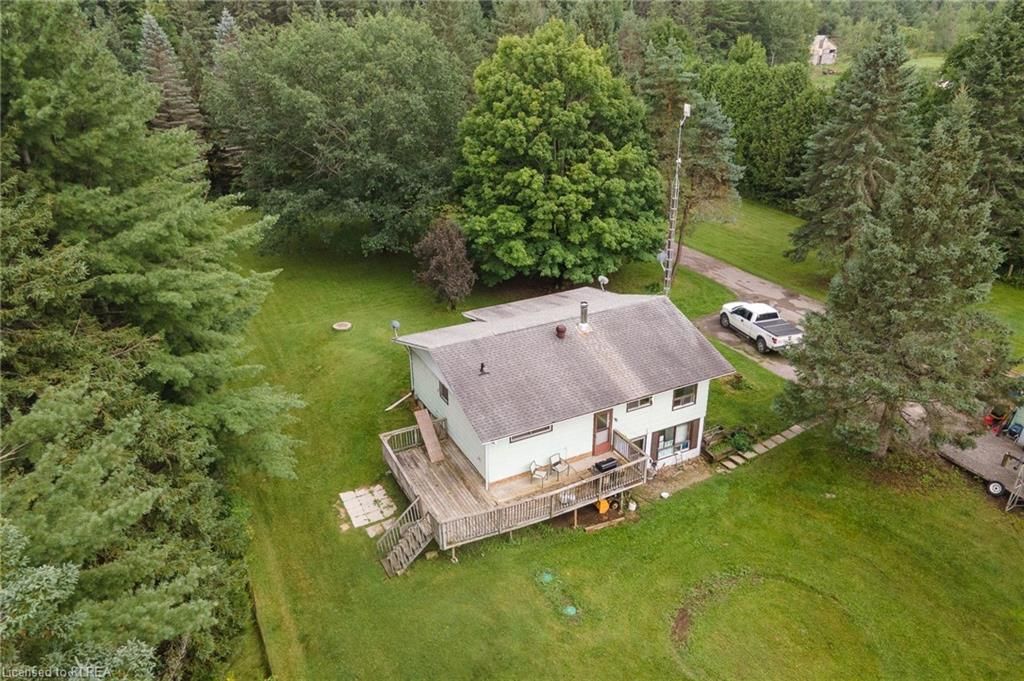
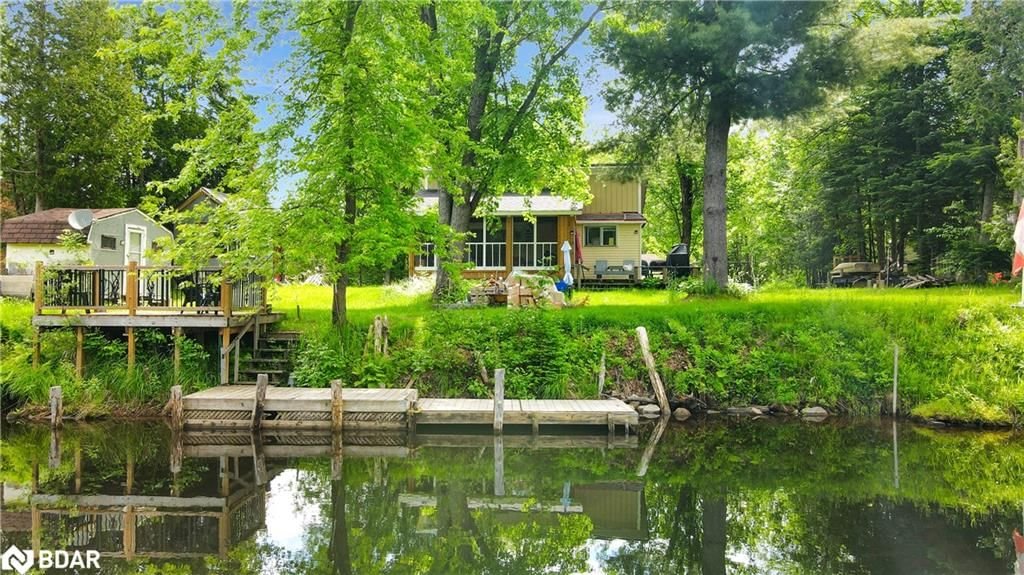
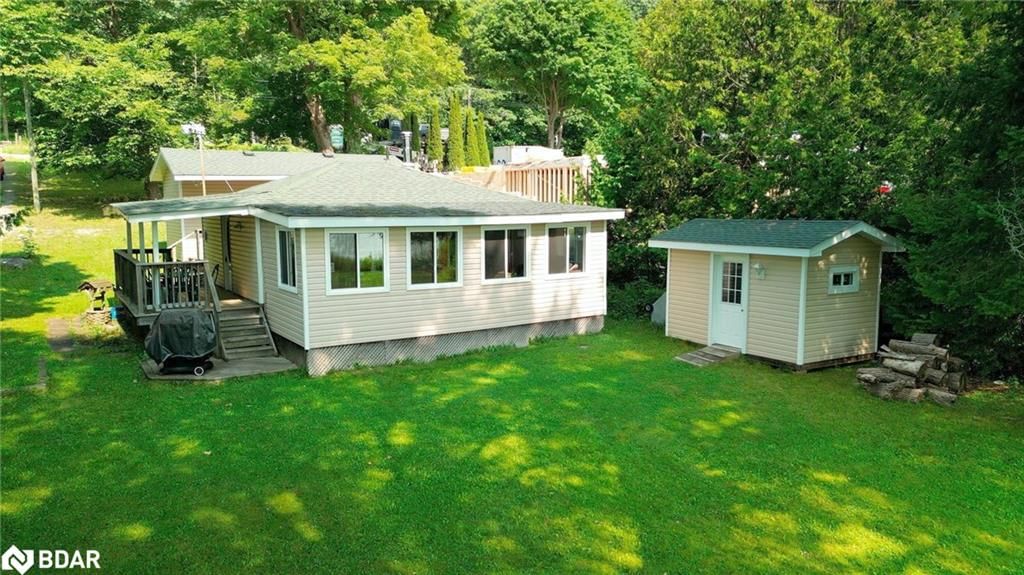
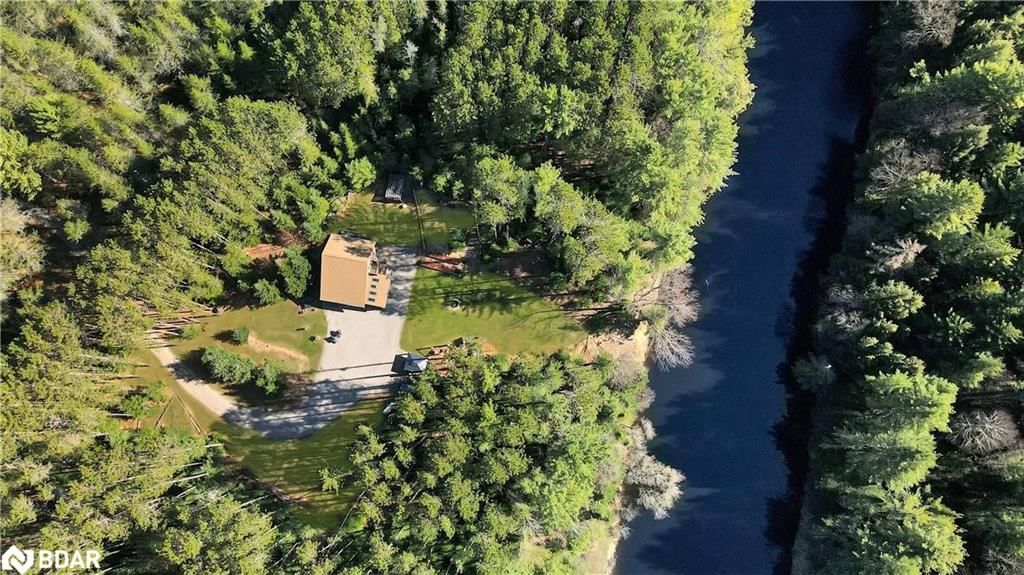
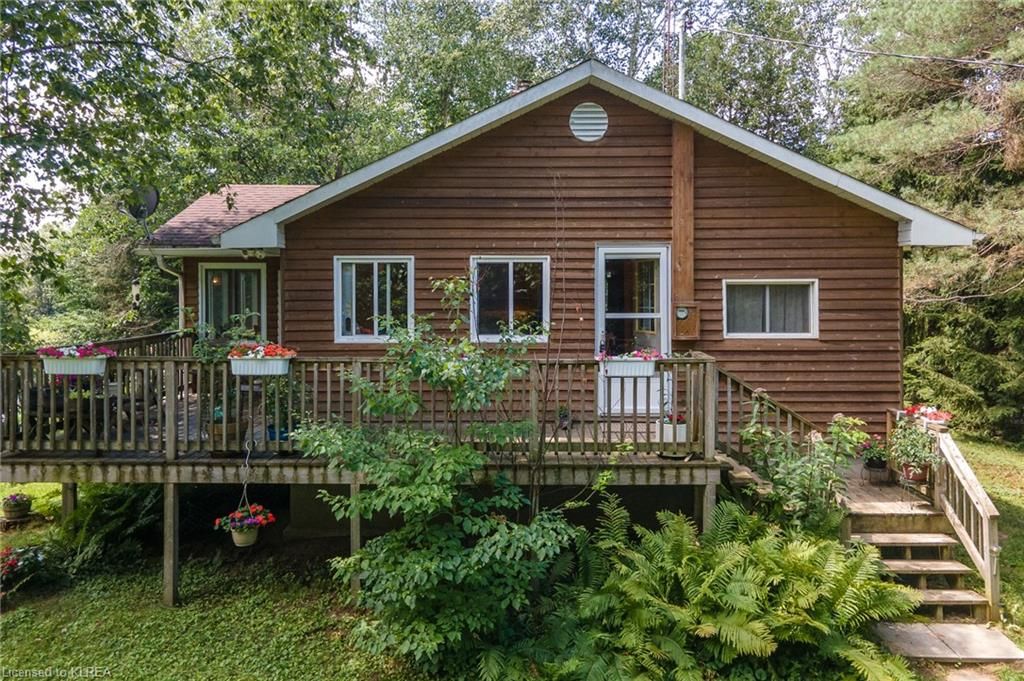
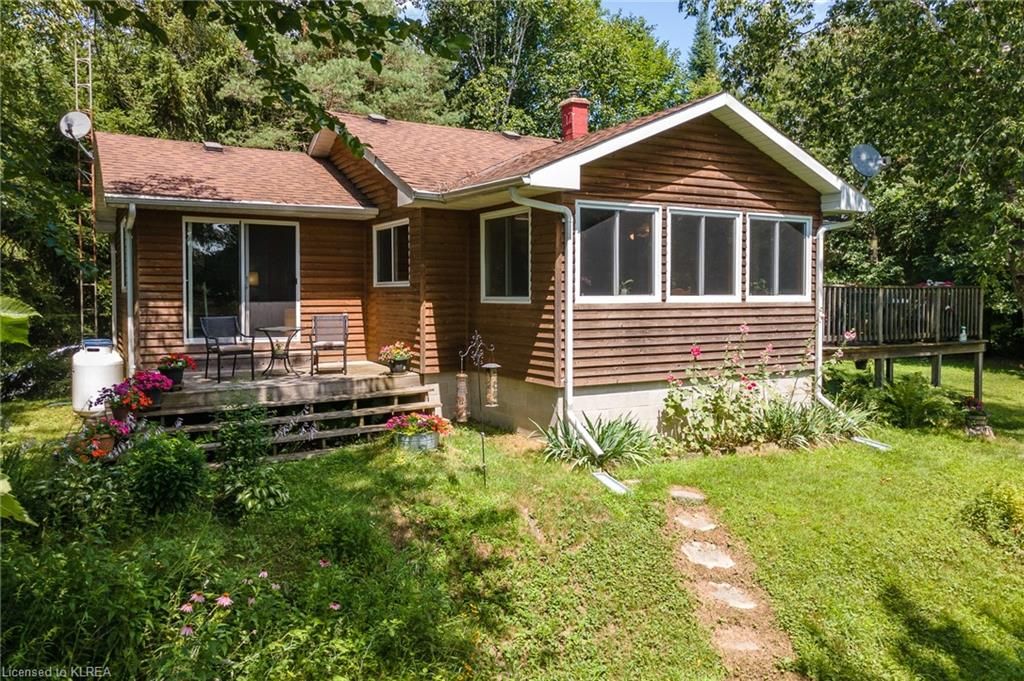
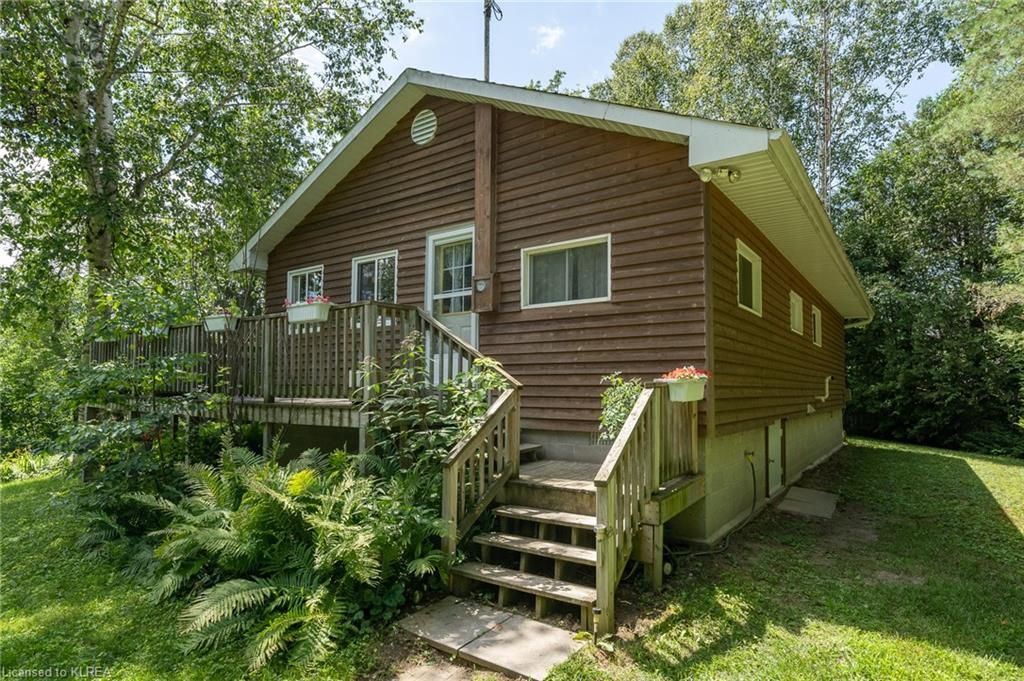
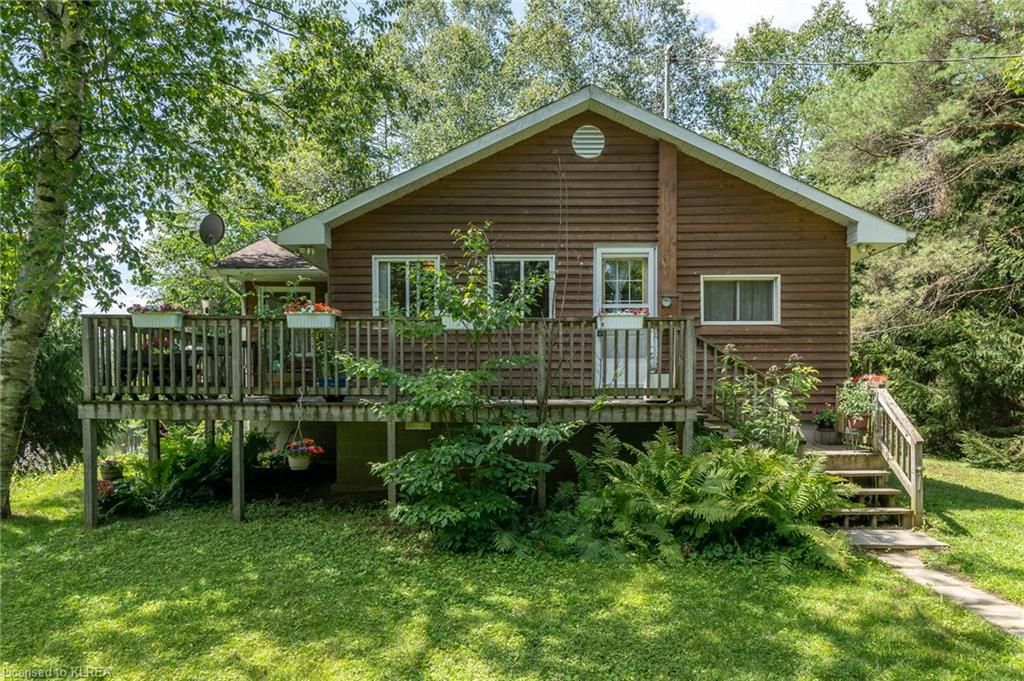
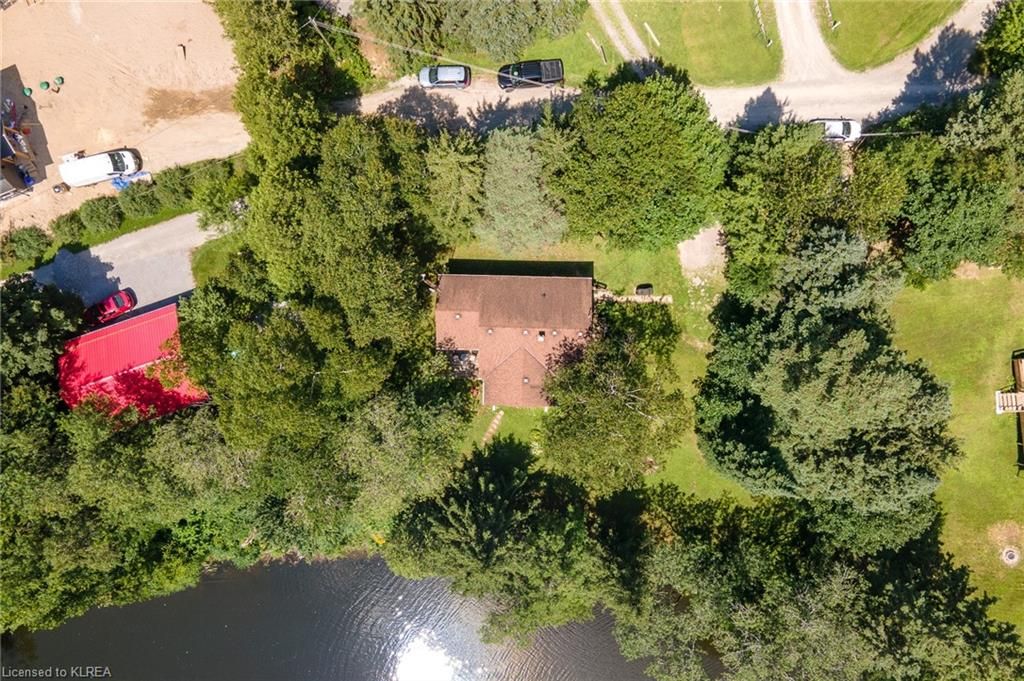
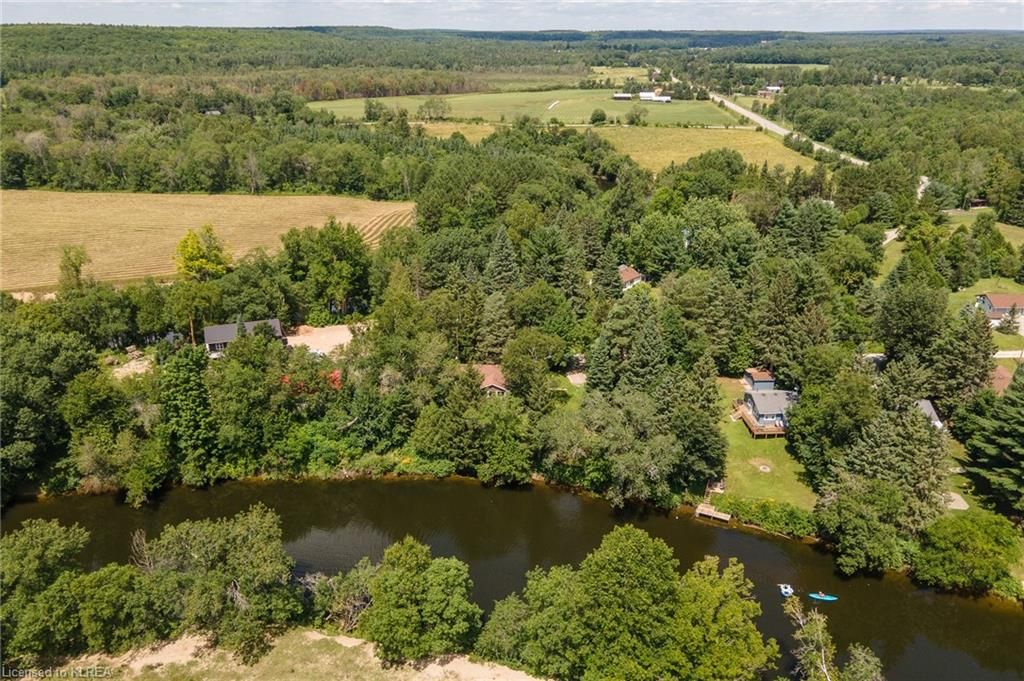
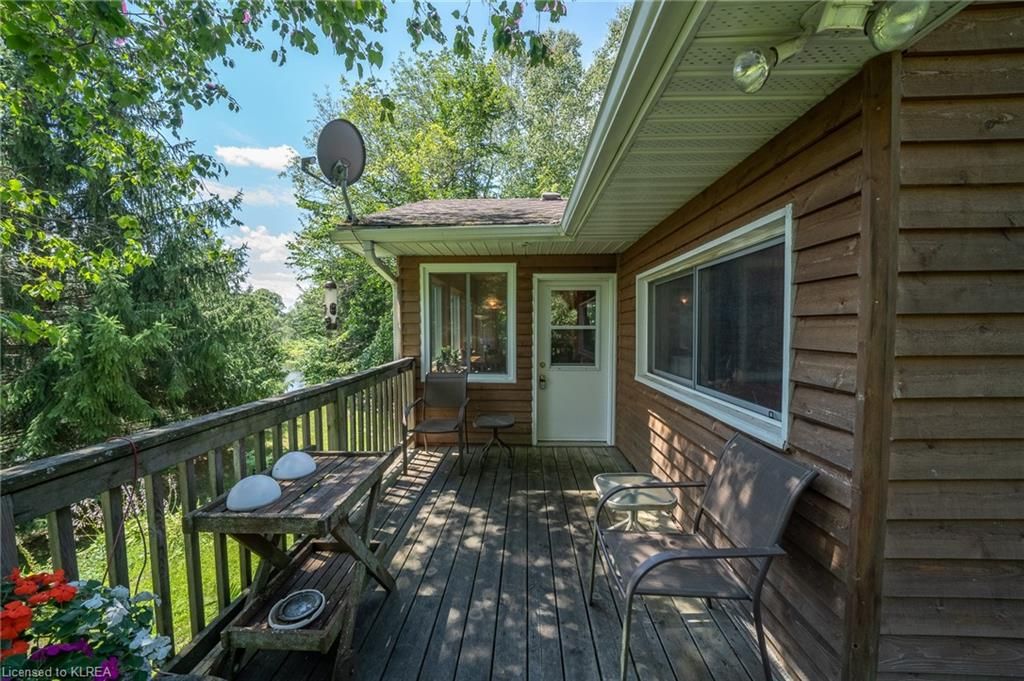
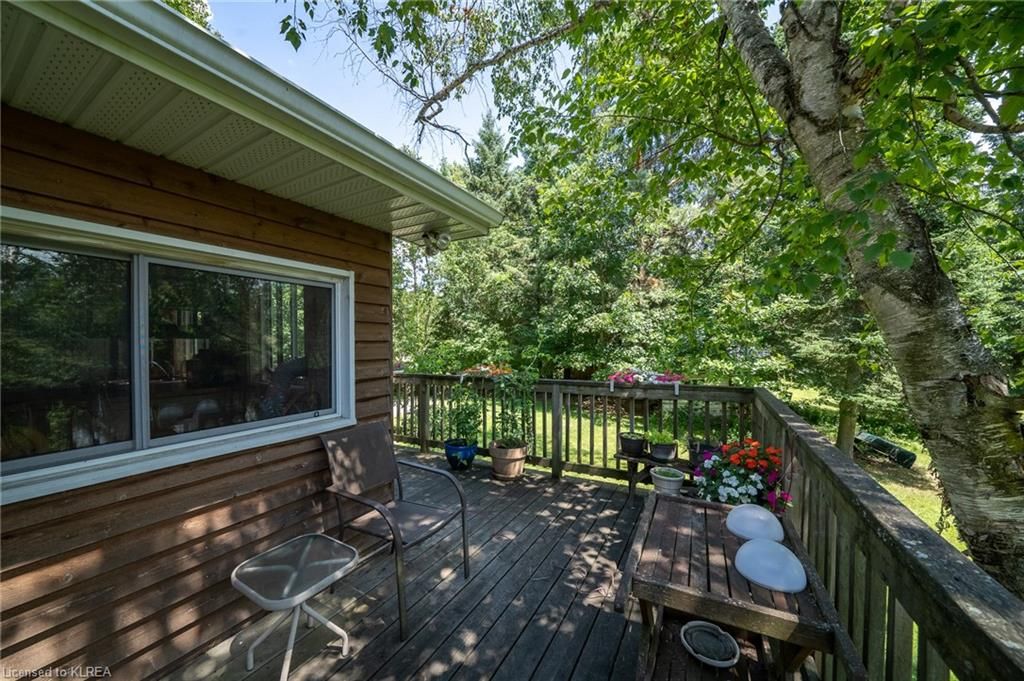
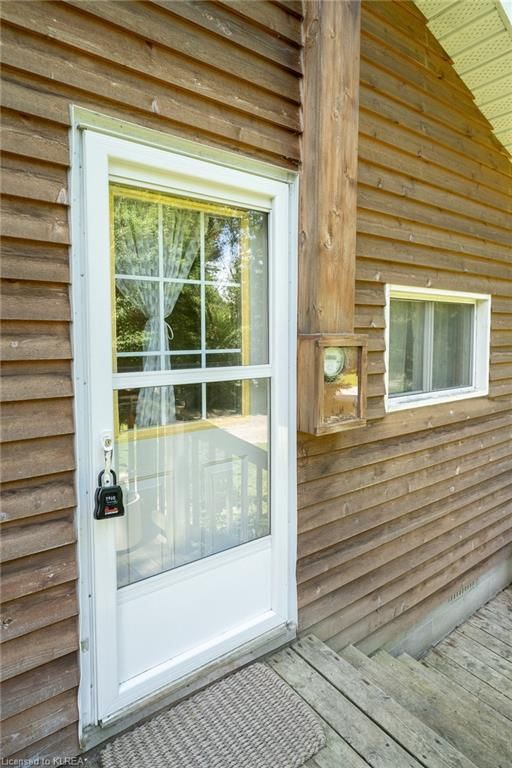
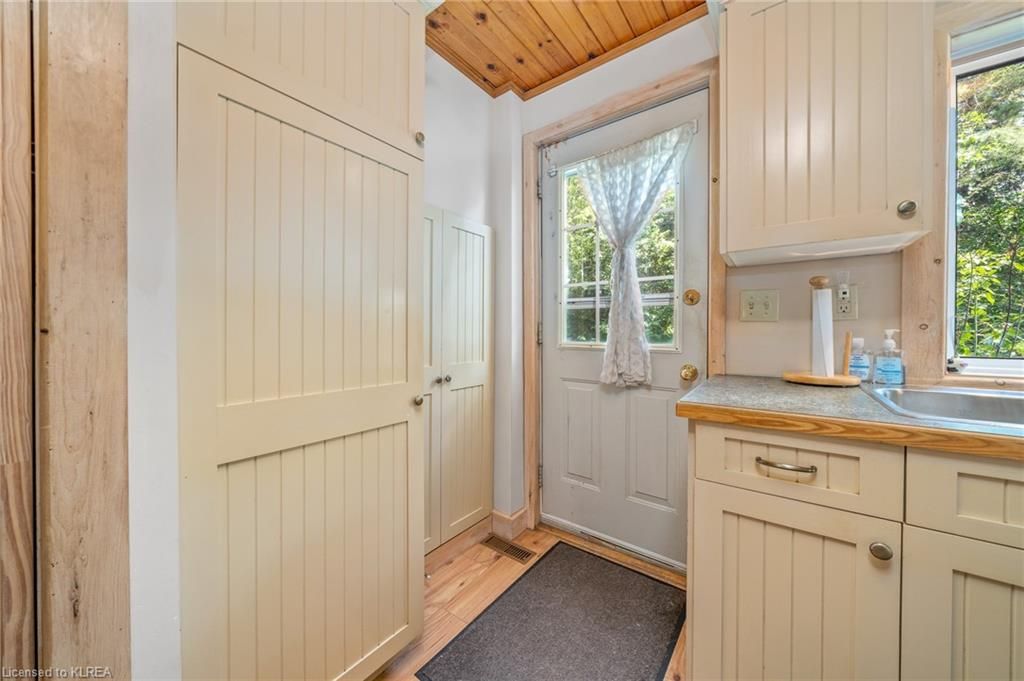
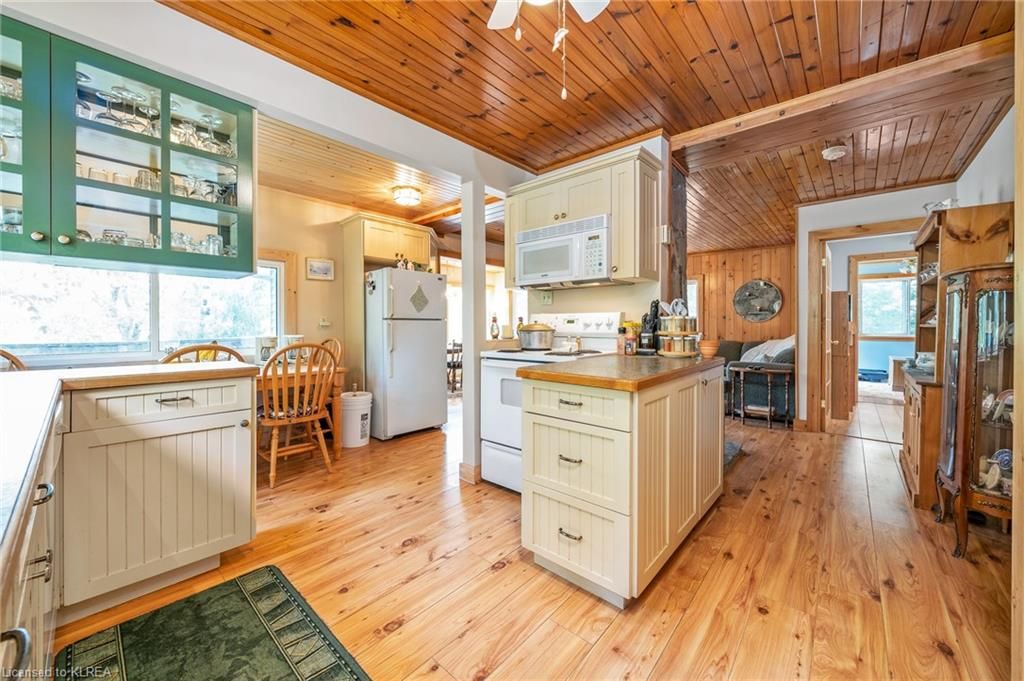
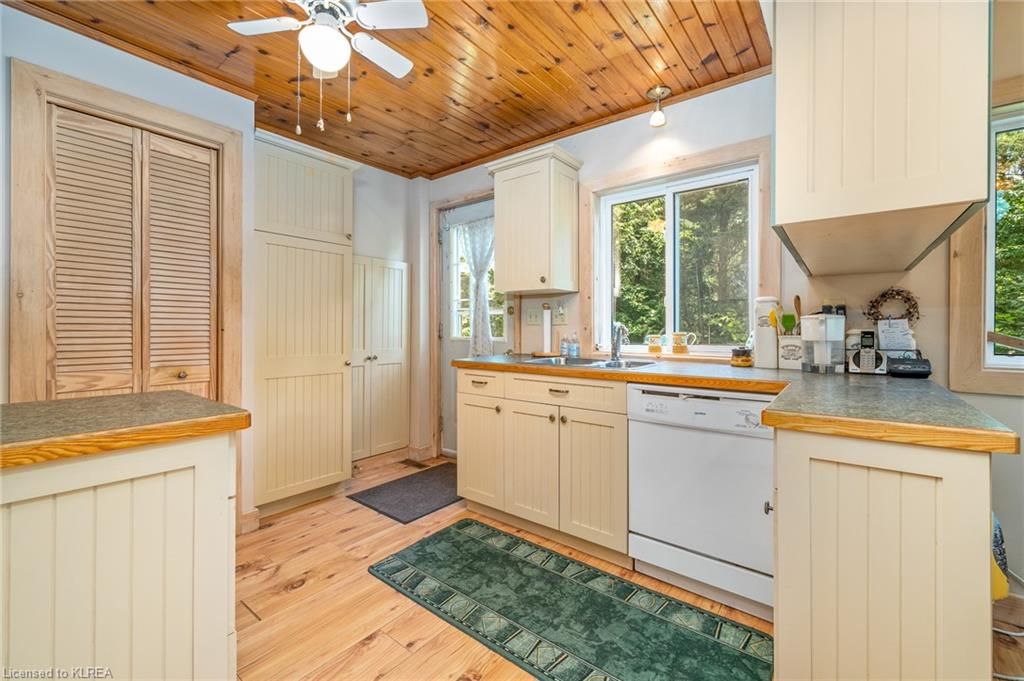
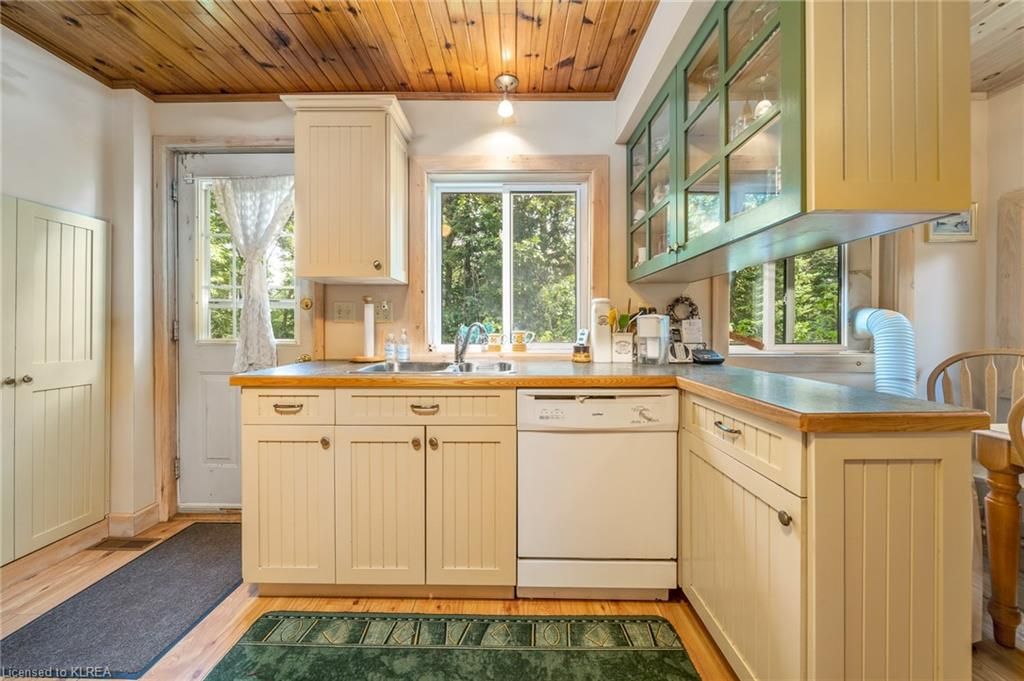
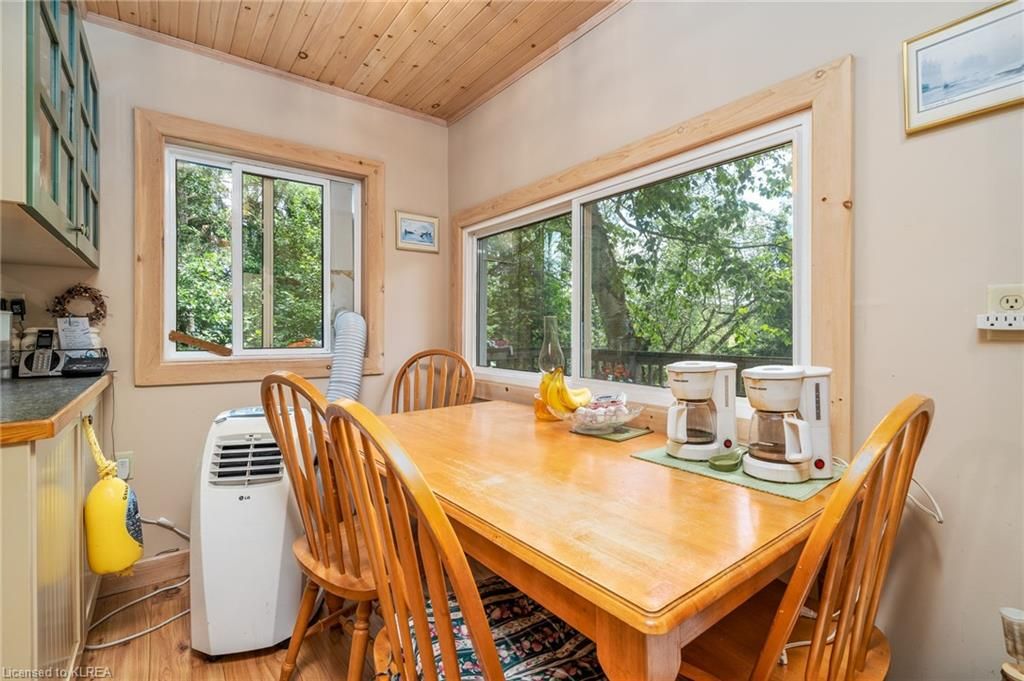
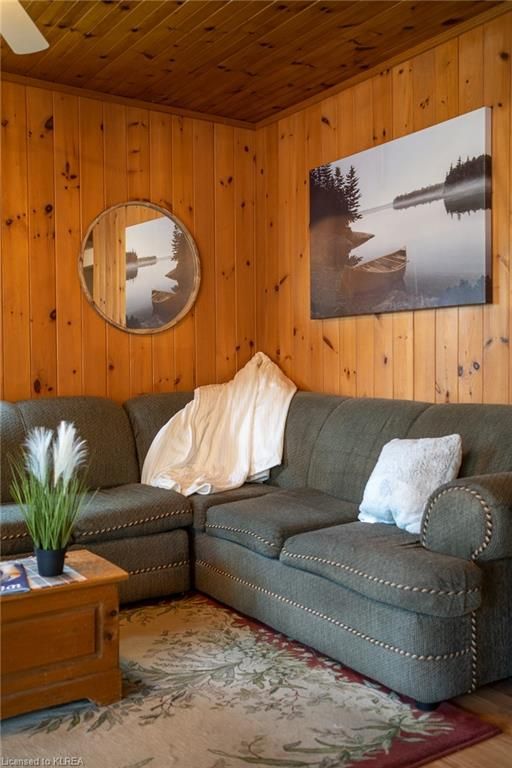
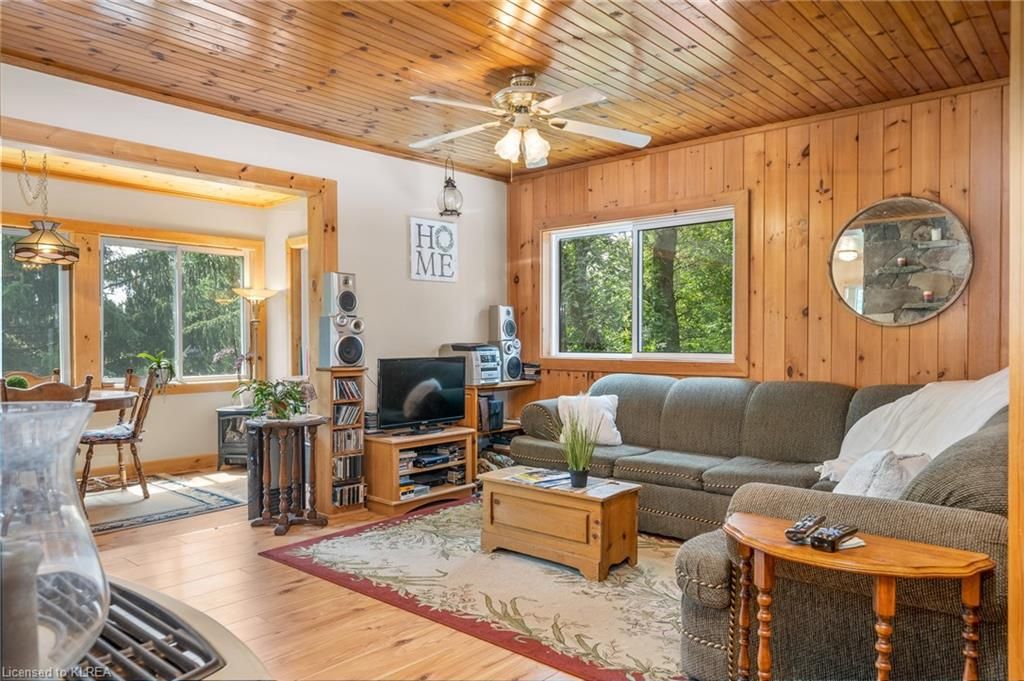
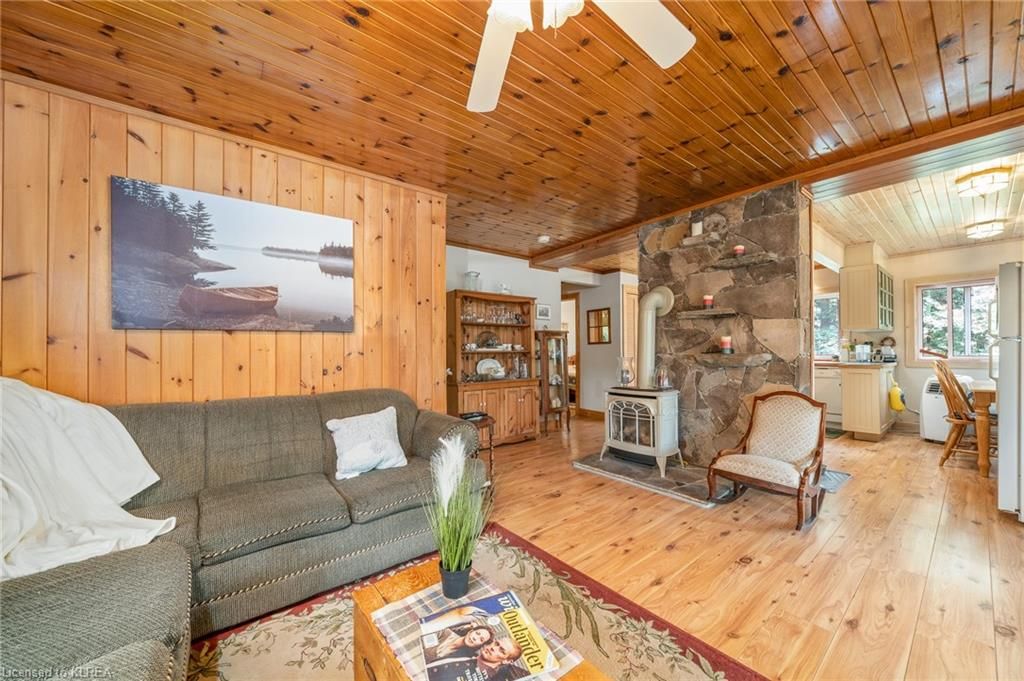
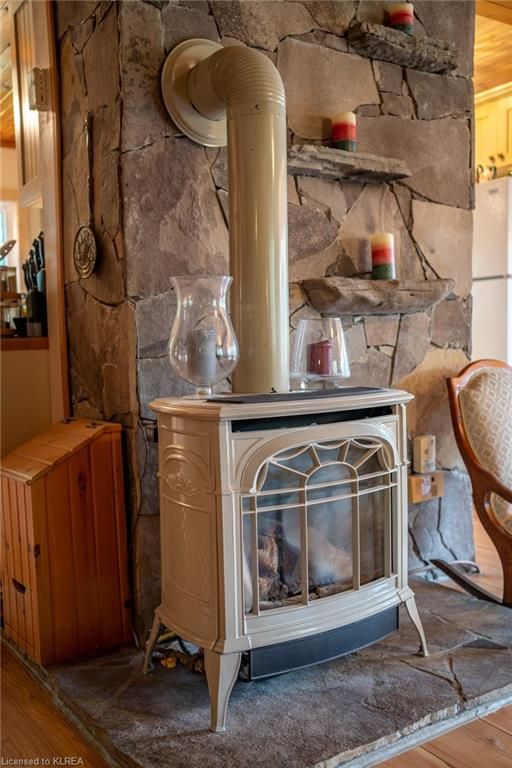
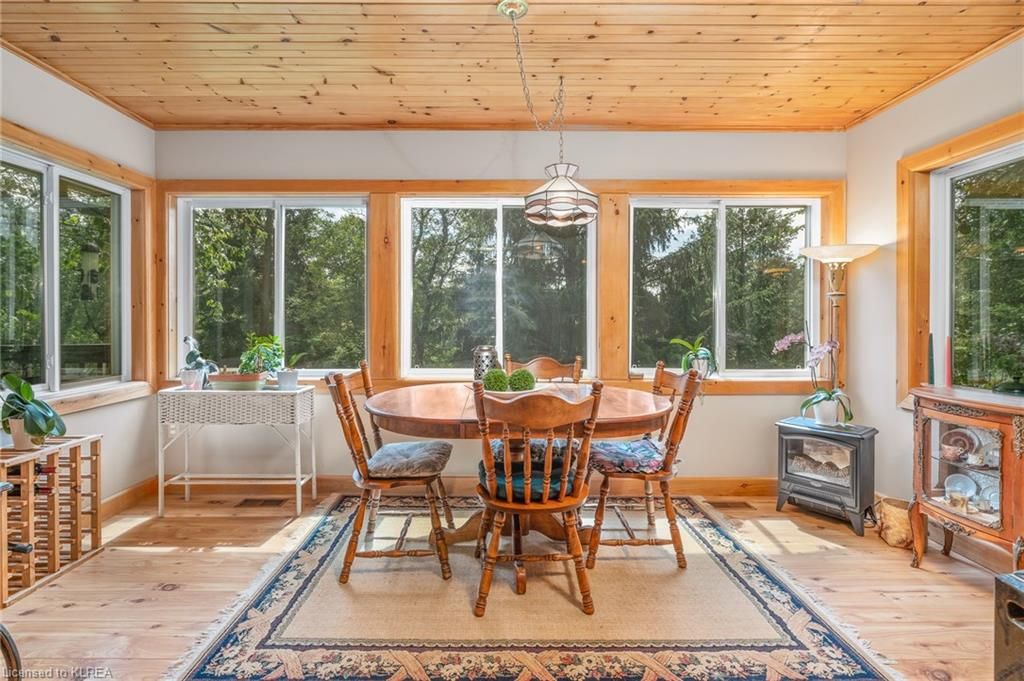
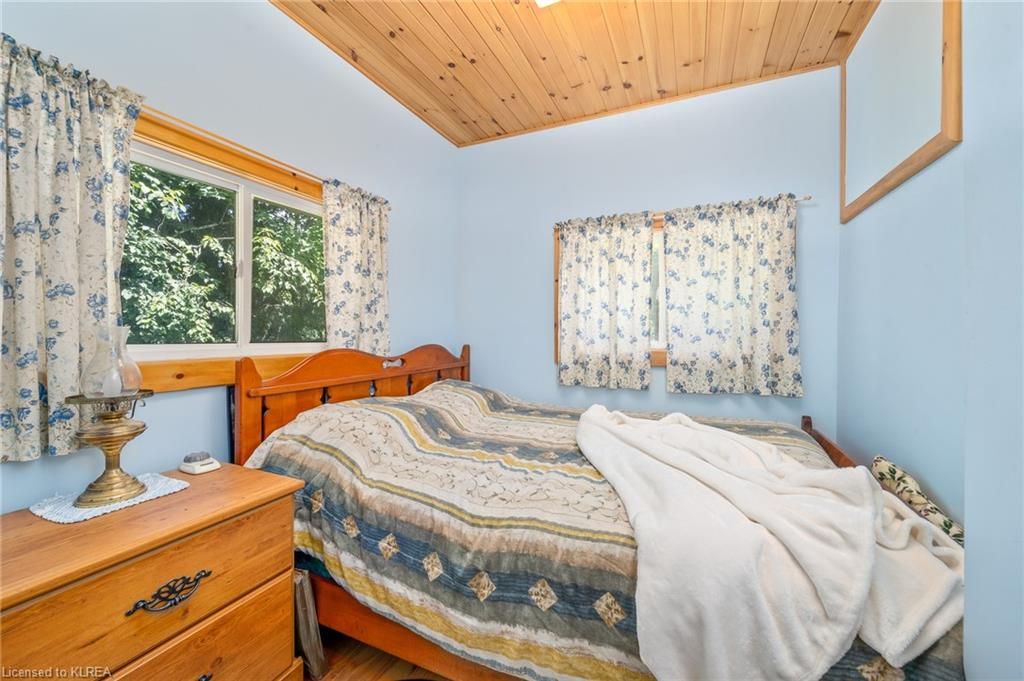
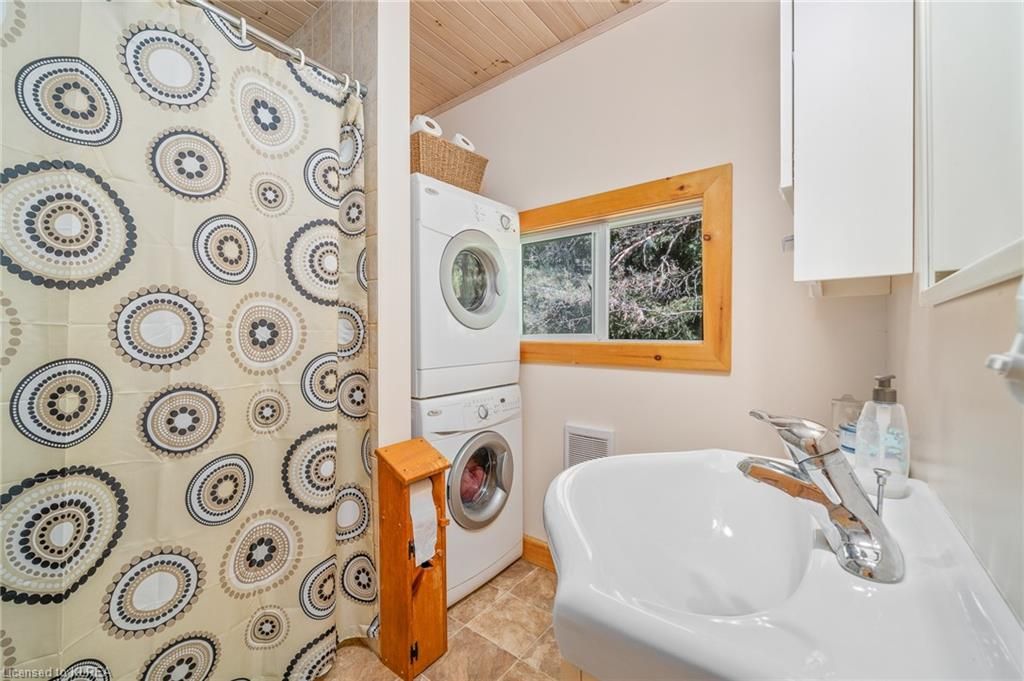
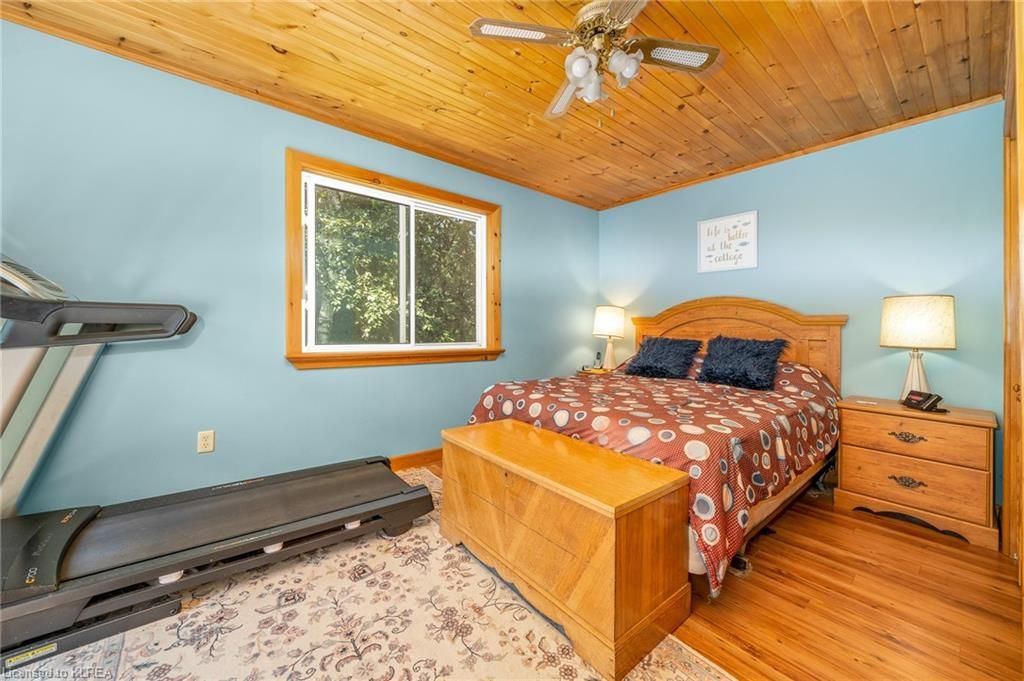
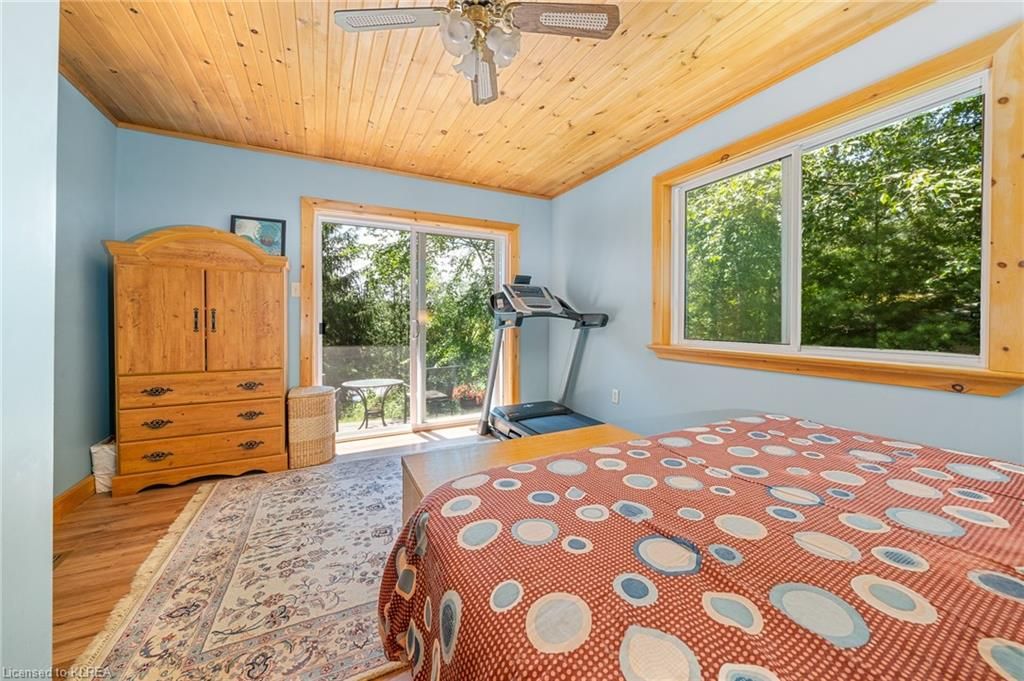
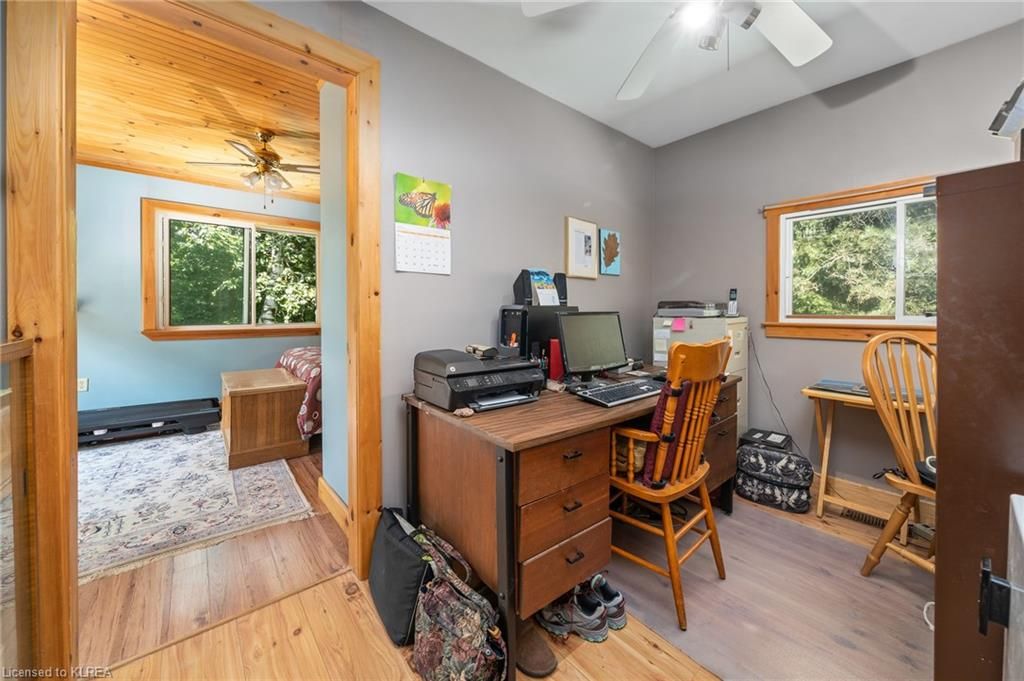
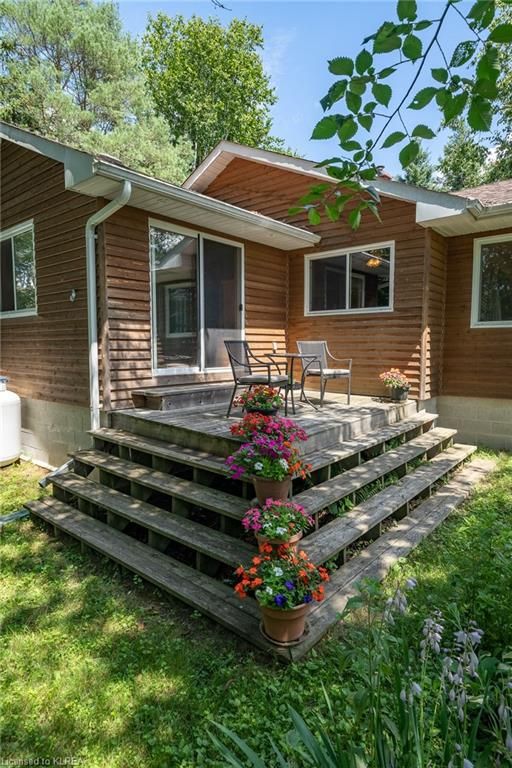
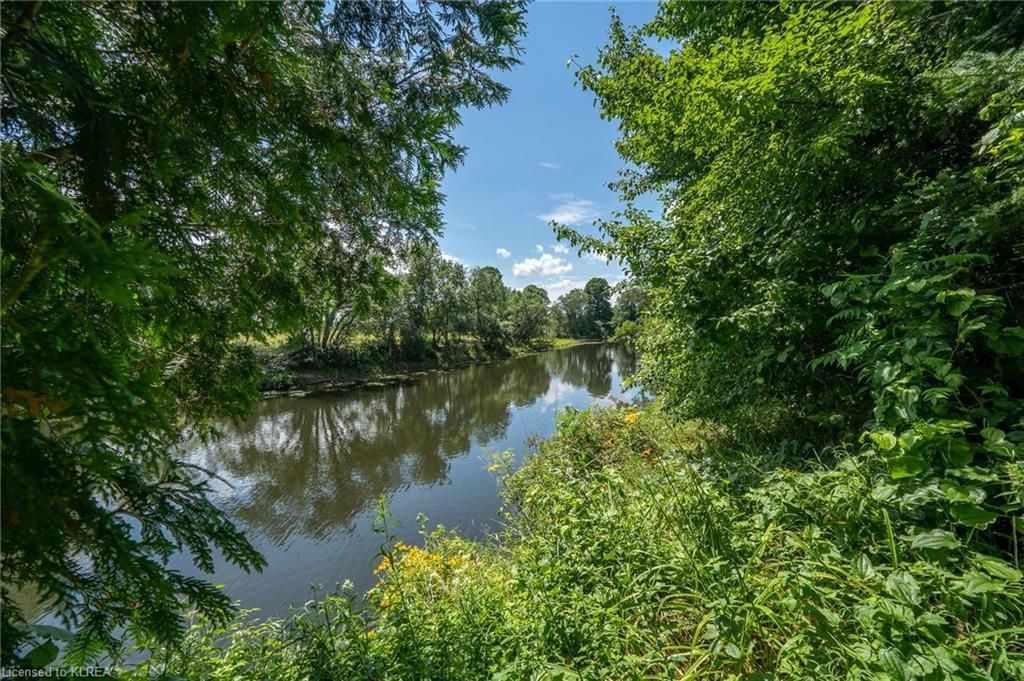
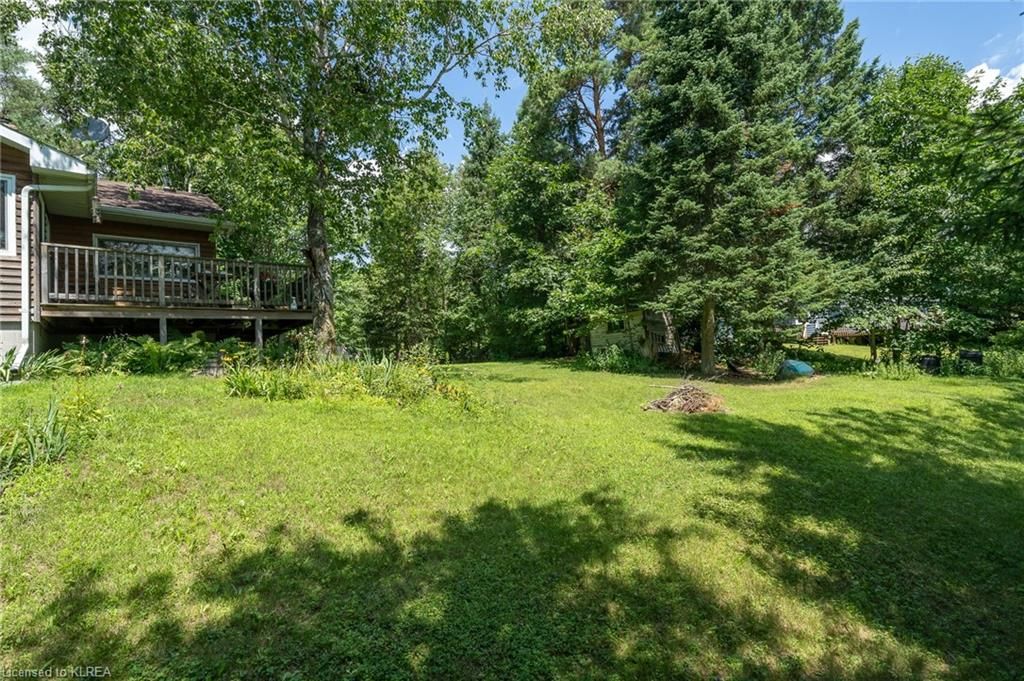
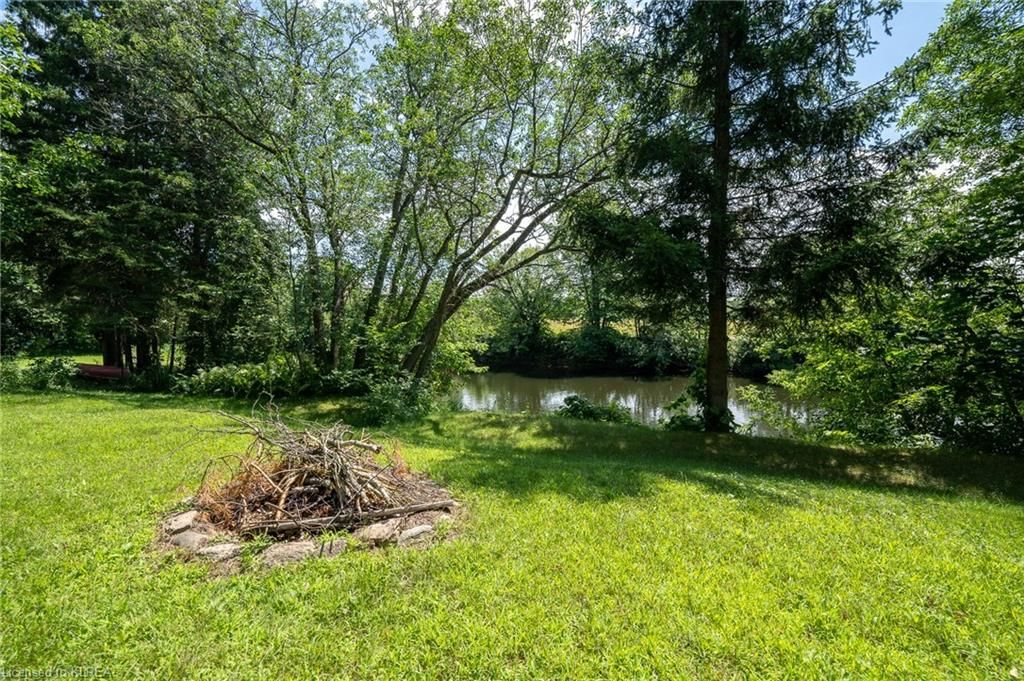
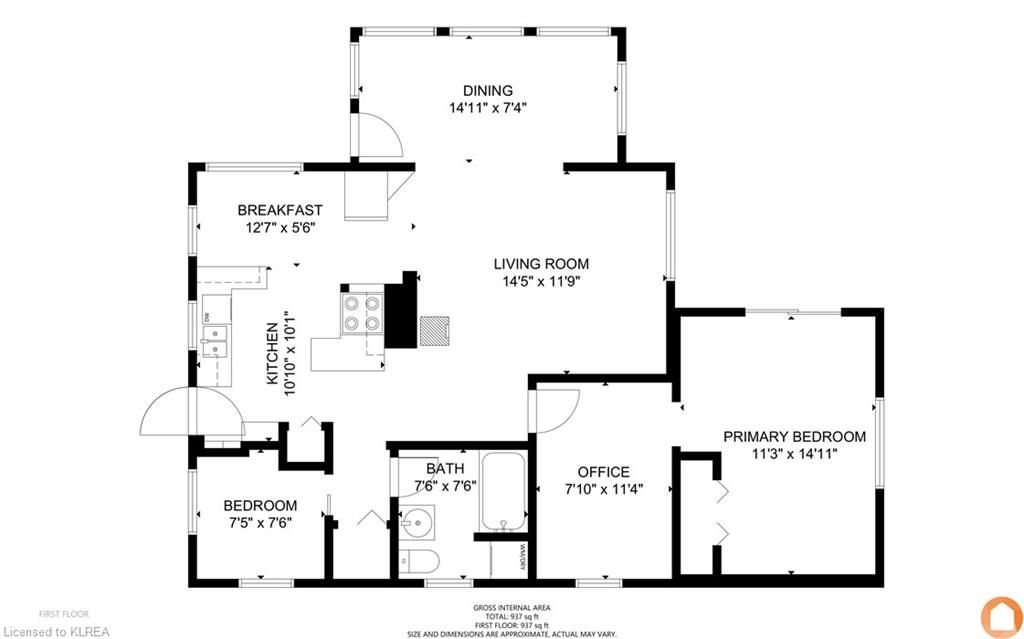
ESCAPE TO YOUR PICTURE PERVECT 4-SEASON GETAWAY ALONG THE BURNT RIVER - This wonderful property can be used as a full-time residence or as your cottage. Conveniently located just north of Fenelon Falls, you are nicely tucked away on 130 ft of riverfront that is private & secluded. The home was raised with new block & poured foundation in 2008 & completely renovated throughout Your superb retreat awaits with 2 bedrooms, an office, 1 bathroom, plus an eat-in kitchen, spacious living room & sunroom (currently being used as a dining area). It is immaculate & the finishing touches including the pine ceilings, laminate flooring & tons of window make this a great home! And with 0.35 acres, you'll see & enjoy a wide range of flower gardens bursting with colour & style, making this property irresistible. Enjoy your fantastic views of the river from one of two walk-outs. Spend evenings gazing at the bucolic view, or drop a kayak or canoe in the river, or go for a swim! In the crawl space, you'll find all utilities including a new furnace (2021), as well as the water equipment & a well insulated space. Time to make some new memories. Time to love where you live!
Carbon Monoxide Detector,Dishwasher,Dryer,Microwave,Refrigerator,Smoke Detector,Stove,Washer,Window Coverings,Most Furnishings, Electric Stove (Heater) In Dining Room, Living Room Rug, Bbq, Canoe, 2 Desks In Office, Green Lawnmower (As Is), Treadmill In Bedroom, All Electric Light Fixtures.
Copyright 2025 Information Technology Systems Ontario, Inc. The information provided herein must only be used by consumers that have a bona fide interest in the purchase, sale, or lease of real estate and may not be used for any commercial purpose or any other purpose.
Bedroom
Bedroom Primary
Office
Living Room
Dining Room
Kitchen
The graph below compares the average list price and average sale price of homes in this neighborhood by month for the last 24 months. When average sale price is greater than average list price, this may suggest a buyer's market. When average sale price is lower than the average list price this may suggest a seller's market.
The graph below illustrates the average days on market for homes in this neighborhood. The yellow area may indicate a buyer's market, the green area may indicate a balanced market and the red area may indicate a seller's market.
Fenelon Falls, Fenelon Falls (Town), K0M 1N0
Fenelon Falls, Fenelon Falls (Town), K0M 1N0